
For SaaS and subscription companies, having a clear understanding of their customers – who’s joining, who’s leaving, why they stay, and where you lose them – is the backbone of driving consistent MRR growth.
But as you scale with new products, payment methods, and geographies, tracking all your subscription KPIs across various systems quickly becomes a real struggle.
Too often, growth and payments managers find themselves piecing together data from Excel sheets and various disconnected platforms, only to find more confusion than clarity. If you want controlled, scalable growth, you need your billing insights and subscription data centralized, clear, actionable, and connected to your payment stack – not scattered across multiple platforms.
For years, Solidgate has been the quiet payments engine behind some of the world’s most ambitious SaaS and subscription businesses. Now, we’re the first payment orchestrator to introduce a Billing dashboard that consolidates your subscription analytics and reporting in one place.
Here’s how our new Billing dashboard gives payments and growth teams more control.
Billing dashboard: What’s inside?
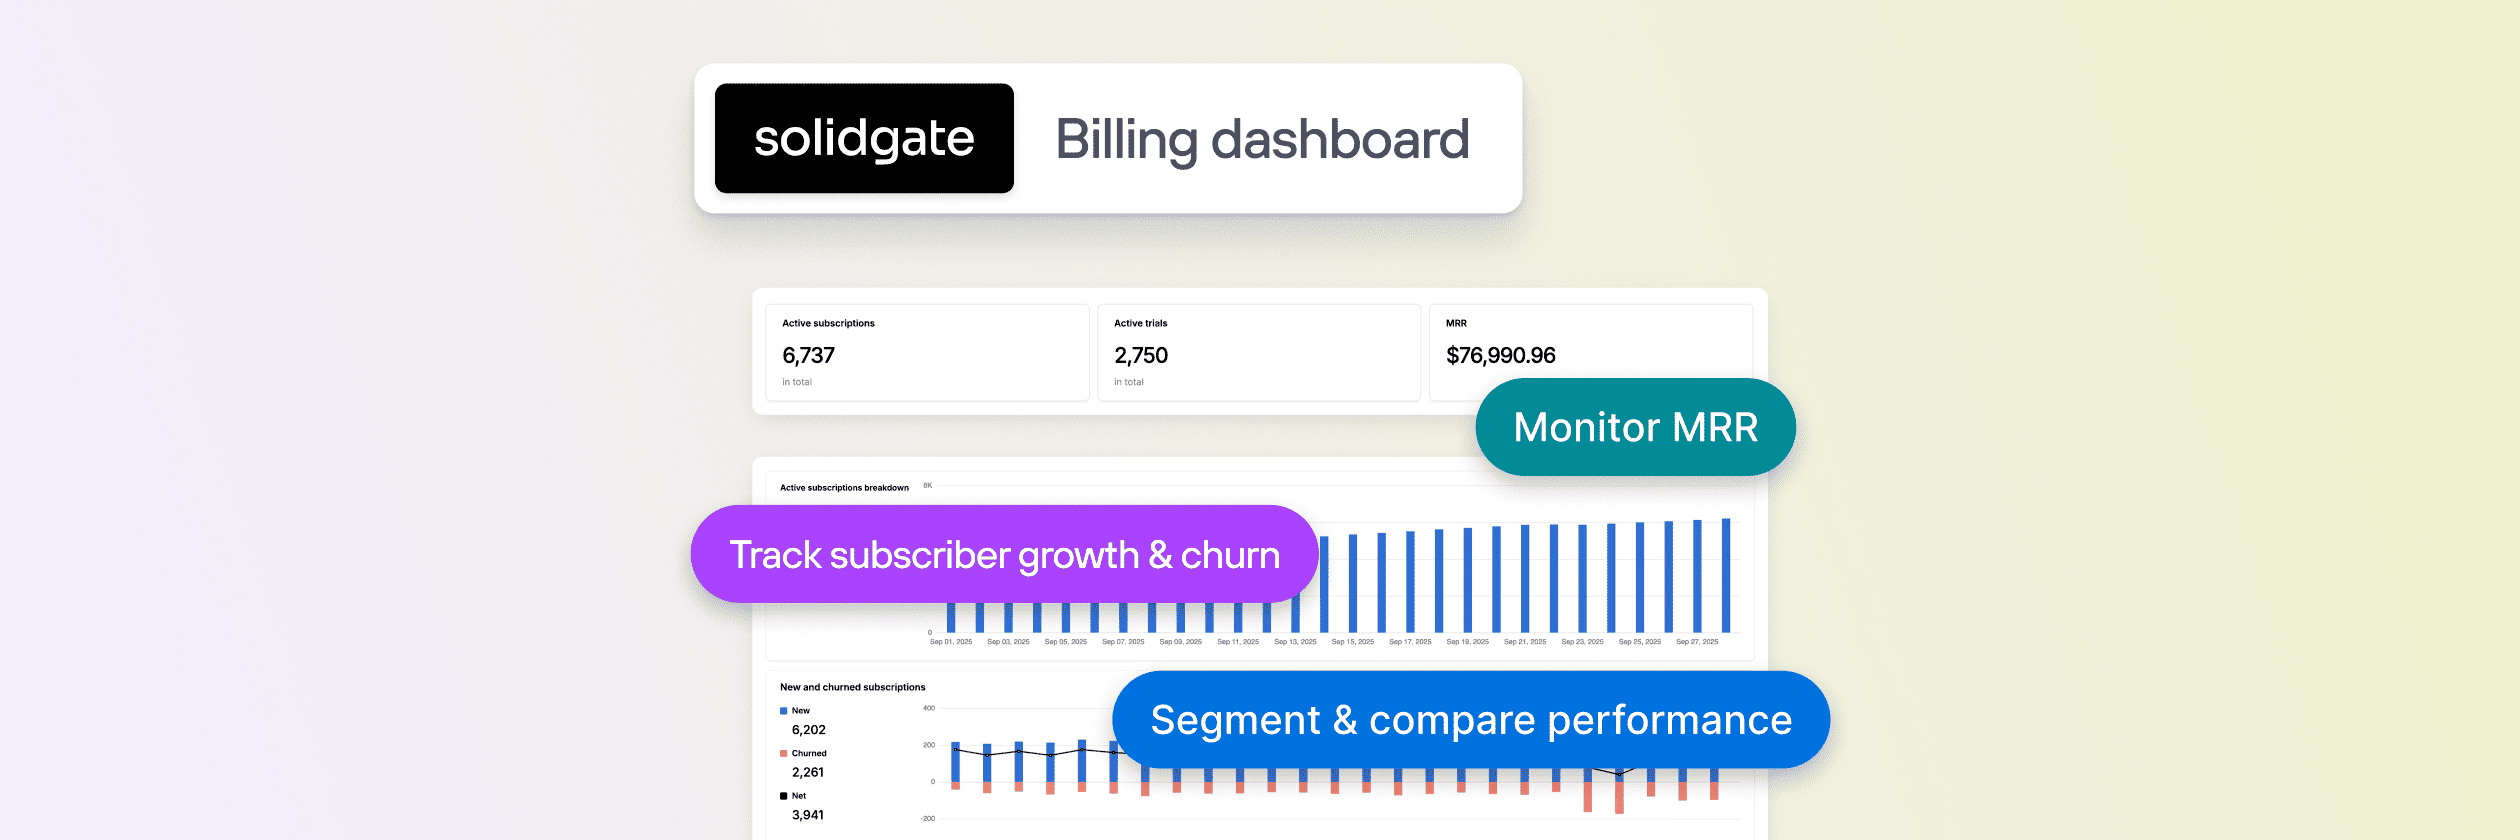
Billing dashboard is more than just a tool – it’s a way to scale your recurring revenue operations. Think of it as your mission control for all your top subscription KPIs.
Available to all Solidgate merchants in the Billing section of Solidgate HUB, it provides you with clear and accurate subscription reporting, allowing you to:
✔️Track subscriber growth and churn
Monitor your active subscriptions and trials to understand how your subscriber base evolves. This lets you spot trends early and address churn before it escalates.
✔️Monitor revenue
Keep a close eye on your Monthly Recurring Revenue (MRR) and other key financial metrics to ensure that your income remains stable and predictable.
✔️Segment and compare performance
Filter your data by product, channel, or billing period to uncover which areas are driving success and which need more attention.
Let’s see how the dashboard’s tabs break down these benefits and make your day-to-day operations easier.
Overall tab
The Overall tab consolidates your core subscription data in one place. At the top, you’ll find summary cards that give you an instant view of the most critical subscription metrics:
- Active subscriptions with the total number of active subscriptions for the current date.
- Active trials with the total number of current active free and paid trials.
- MRR with monthly recurring revenue generated by active subscriptions.
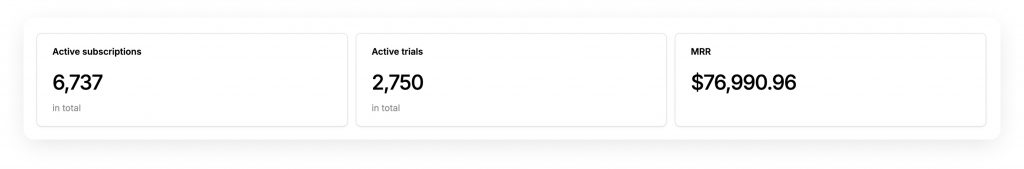
The charts below provide a more detailed visual analysis of key trends and performance metrics, from subscriber growth patterns to trial conversion effectiveness.
✔️Active subscriptions breakdown to quickly spot trends with a visual of total active subscriptions over time.
✔️New and churned subscriptions to easily see how many new signups you’re gaining and how many are churning.
✔️Trial conversion to see how well your trials are converting to paid subscriptions for each trial cohort.
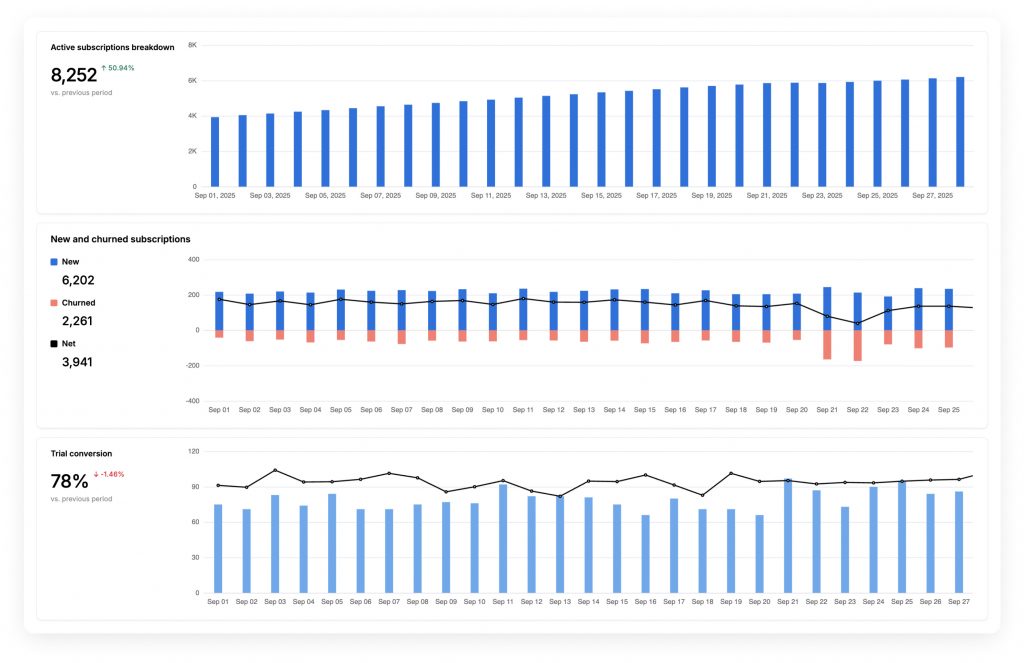
Revenue tab
The Revenue tab gives you insight into the total and recurring income generated from subscriptions.
You can analyze revenue trends and subscription metrics, such as revenue and MRR, to quickly spot performance shifts and evaluate your billing strategy.
✔️ Total Revenue shows your total revenue, including revenue from smart retries, with a clear chart that excludes refunds.
✔️ Monthly Recurring Revenue (MRR) chart allows tracking monthly changes and identifying key drivers like new plans, pricing updates, or churn.
✔️ New vs Churned MRR shows where your recurring revenue is coming from, with a breakdown of New MRR from new subscriptions and Churned MRR from cancellations.
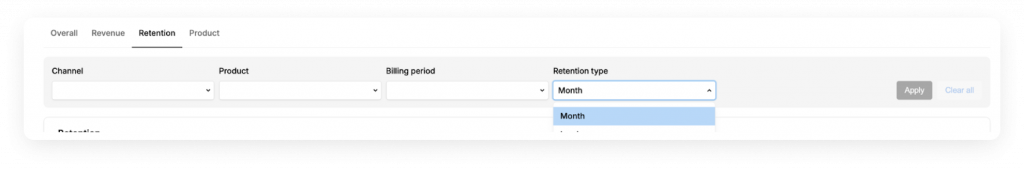
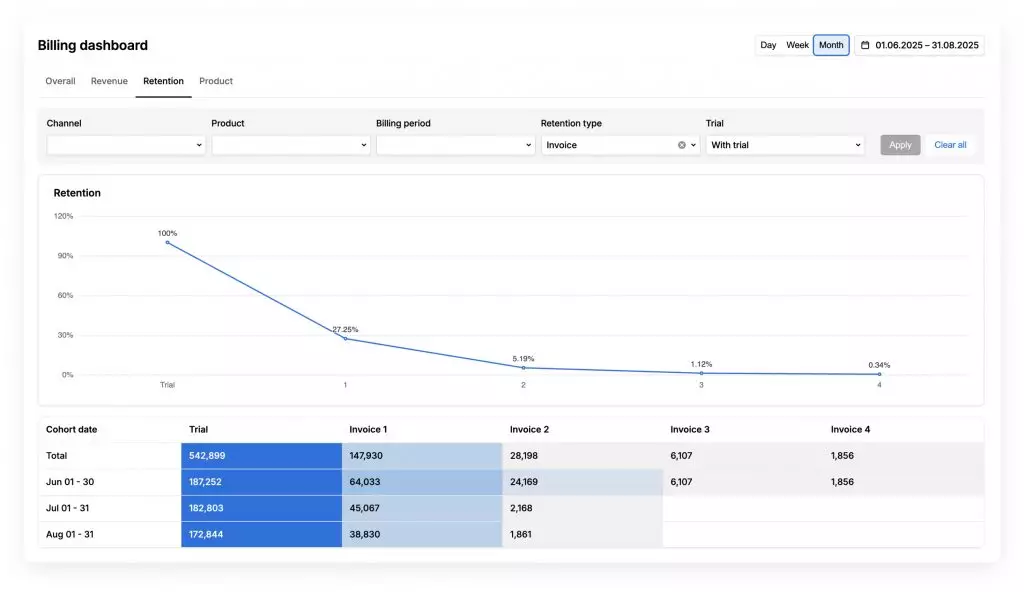
Retention tab
The Retention tab shows how long customers stay subscribed after their initial subscription. By analyzing cohorts over time, you can identify drop-off points, estimate customer lifetime, and better understand how trials, renewals, and billing logic affect customer behavior.
This tab offers two ways to measure retention:
- Invoice-based – Tracks retention based on the number of invoices.
- Month-based – Aligns retention data with calendar months.
With a combination of line graphs and cohort tables, you can easily track retention trends across customer segments and make more data-driven decisions about your retention strategy.
✔️ Retention Chart visualizes how your customer retention is evolving with a simple line graph that shows retention across all cohorts. Hover over data points to see exactly how many subscriptions stay active over time.
✔️ Cohort Table helps dive deeper into retention with a cohort table that shows how many customers from each cohort remain active in later billing periods.
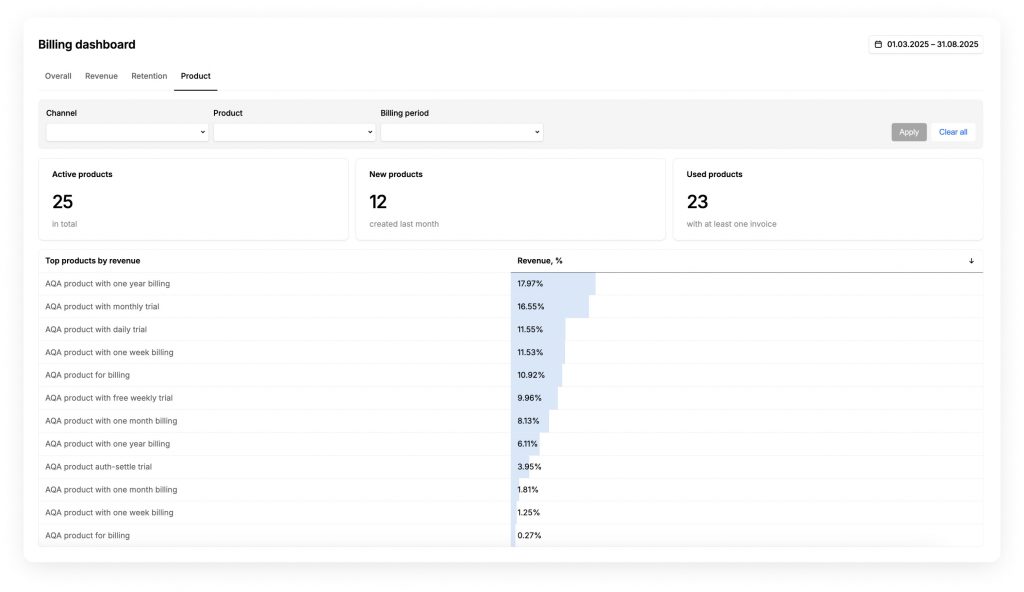
Product tab
The Product tab lets you see which products are generating the most revenue, how they’re being used, and how activity is evolving over time.
At the top of the tab, summary cards provide quick insights into key product metrics:
✔️ Active products with the total number of products currently active, showing the breadth of your product portfolio.
✔️ New products with the number of products launched within the last 30 days, giving you insight into your innovation pipeline.
✔️ Used products show the number of products that have had at least one invoice created, showing real market adoption.
Below, you’ll find a Product chart that allows you to easily analyze revenue growth and product performance across your product portfolio.
Tips for deeper subscription analytics with the Billing dashboard
- Select custom date ranges for granular or broad views
- Group subscription metrics by daily, weekly, or monthly intervals
- Filter data by channel, product, or billing period
By combining multiple filters, you can drill down into specific segments to see exactly what’s driving growth or uncover the root causes of any challenges.
To learn more about the Billing Dashboard, read our docs, or go to Solidgate HUB → Billing section → select Billing dashboard and start tracking your metrics.
New to Solidgate? Discover how our payment solutions help subscription businesses scale globally, or get in touch with our team to discuss how we can help you grow.
FAQ
What are subscription analytics, and why are they important?
Subscription analytics is all about tracking key metrics like subscriber growth, churn, and revenue. It helps you see what’s working, where things are slipping, and where to focus your efforts. These insights are crucial for making smart decisions that help drive long-term growth and minimize churn.
How does the Solidgate billing dashboard improve subscription management?
The billing dashboard centralizes all your key subscription metrics in one place and ties them directly to your payment stack. This gives you real-time insights into subscriber growth, churn, and revenue, all connected to the payments process. By having everything in one dashboard, you can make quicker, more informed decisions that drive your subscription business forward
Can I track custom subscription KPIs with the billing dashboard?
Yes, you can. The Billing Dashboard lets you filter and segment data by product, channel, or billing period. This gives you the flexibility to focus on the KPIs that matter most for your subscription business.
Who can use the Solidgate billing dashboard?
Any Solidgate merchant can access and use the dashboard in the Billing section of Solidgate HUB.

![[Survey] Success with
subscriptions: How businesses can meet customer expectations](https://solidgate.com/wp-content/uploads/2024/10/success-with-subscriptions.png)