Cart abandonment: Rates, causes, and what actually reduces it
Payments 101
Updated 2 Sept 2026
9 min

Anton Tsyslytskyi
Product Manager, Solidgate
Seven in ten online carts get abandoned before checkout. Here's what the number actually means, what drives it, and where the real recovery opportunity sits.
A shopper found your product, chose a variant, added it to their cart, and left without buying. That happens to roughly 7 in 10 carts in – a global average cart abandonment rate of 70.22%, stable across a decade of measurement.
Some of that 70% is unavoidable. Shoppers browse, compare prices, and save items for later without ever intending to buy that session. But strip that out, and what remains splits into two different problems.
One is checkout friction: a form that asks too much, a shipping cost that appears too late, a mandatory account before checkout.
The other is payment failure: a card gets declined, or a shopper's preferred payment method isn't there.
Both happen at checkout. Neither tells the merchant – or the shopper – whether the sale was ever recoverable.
This guide covers what cart abandonment measures, what a normal rate looks like by industry, the true cost of an abandoned cart, and the reasons behind it along with what fixes each one.
TL;DR
- Cart abandonment measures the full add-to-cart funnel – from the moment a product enters the cart to the final payment step.
- The global average sits at 70.22%, but that figure hides a wide range by industry – some categories run near 80%, others closer to 50%.
- A large share of abandonment is unavoidable browsing behavior, and even after removing it, checkout usability issues alone represent an estimated $260 billion in recoverable orders across the US and EU.
- Beyond the familiar causes – cost surprises, forced accounts, slow checkout – a real share of abandonment traces to the payment layer: declines, missing payment methods, and failed retries that shoppers can't diagnose from their side.
- Reducing cart abandonment means fixing checkout UX and the payment layer. Each requires different tools, and leaving either one unaddressed means leaving recoverable revenue on the table.
What is cart abandonment?
Cart abandonment – sometimes called shopping cart abandonment – occurs when a shopper adds a product to their cart but exits before completing the purchase. It covers the full funnel, from the moment a product enters the cart to the final payment step.
Cart abandonment vs checkout abandonment
Checkout abandonment is narrower – it measures drop-off after a shopper has already started entering payment and shipping details.
The two metrics diagnose different problems. A high cart-abandonment rate with a low checkout-abandonment rate means shoppers are leaving before they ever reach payment. Browsing behavior or product-page friction is the likely cause here.
A high checkout-abandonment rate means they're reaching payment and stopping there – friction in the payment or shipping steps is where to look.
What is the average cart abandonment rate?
The average cart abandonment rate is 70.22%, based on aggregate of 50 independent studies.
That figure has barely moved in a decade. Baymard's data shows the aggregate holding close to 70% since 2014 – which means the rate itself isn't the signal. What matters is what's inside it.
Baymard's own survey data attributes 43% of abandonment to shoppers who were browsing without purchase intent. That share reflects window shopping, price comparison, and saving items for later.
Core insight: A near-70% abandonment rate is not a sign of a broken checkout on its own. The number only becomes actionable once it's segmented by cause.
Average cart abandonment rate benchmarks by industry
Industry benchmarks vary more than the global average suggests. rolling 12-month data, shows an almost 30-point spread across the eight verticals it tracks.
| Industry | Average cart abandonment rate |
| Beauty & personal care | 79.81% |
| Home & furniture | 78.81% |
| Luxury & jewelry | 78.81% |
| Fashion, accessories, and apparel | 78.74% |
| Multi-brand retail | 76.92% |
| Food & beverage | 75.56% |
| Consumer goods | 64.94% |
| Pet care & veterinary services | 51.10% |
, tracked separately across its own retail client base, shows the same directional pattern: higher-consideration categories like home furnishings and luxury apparel run above the global average, and everyday repeat-purchase categories run below it.
The spread matters for benchmarking. A fashion retailer at 78% is performing in line with its category. A consumer goods merchant at 78% is nine points above its vertical norm and has a specific problem to investigate.
Core insight: A merchant's cart abandonment rate only means something relative to its own category. The global 70.22% figure is a reference point, not a benchmark.
What does cart abandonment cost your business?
Every abandoned cart with genuine purchase intent is a sale that didn't happen – on traffic you already paid to acquire. Here are some of the most direct business costs it creates.
Wasted acquisition spend. You paid to bring that shopper to your site. When they leave without buying, that cost produces nothing. At a 70% abandonment rate, the majority of your traffic investment generates no return.
Permanent revenue loss. Most shoppers who abandon don't come back. Without an active abandoned cart recovery sequence, that cart is gone. Baymard Institute estimates $260 billion in orders go unrecovered each year across the US and EU – purely from checkout usability issues.
Compounding growth drag. Every point of abandonment you don't fix is a recurring revenue leak on the same traffic base, every month. As volume grows, the absolute loss grows with it.
Lost recurring revenue. For subscription businesses, a that goes unrecovered costs every billing cycle that follows. Baymard's data shows 18% of actionable abandonment traces to payment failure: and missing payment methods. Across Solidgate's merchant base, smart retry logic improves first retry conversion by 51–67%.
Core insight: Cart abandonment costs more than one lost sale – it drains acquisition spend, compounds into recurring revenue loss, and for subscription businesses, turns a single failed payment into ongoing churn.
Top reasons for cart abandonment
| Reason | Share of shoppers |
| Extra costs too high (shipping, tax, fees) | 39% |
| Delivery too slow | 21% |
| Didn't trust the site with card information | 19% |
| Site required account creation | 19% |
| Checkout too long or complicated | 18% |
| Returns policy unsatisfactory | 15% |
| Website errors or crashes | 15% |
| Couldn't see total cost up front | 14% |
| Not enough payment methods | 10% |
| Credit card declined | 8% |
Source: , checkout usability research.
The top five reasons are UX and pricing-transparency problems: cost surprises, forced accounts, slow checkout, unclear totals, and site errors.
Payment methods and declines sitting at the bottom of the list may look like a small problem, not worth prioritizing. But most card declines are soft – temporary failures a retry can recover. A shopper in Brazil who doesn't see PIX, or one in Poland without BLIK, won't complain – they'll just leave. A shorter checkout form doesn't fix either of those because the cause sits deeper, in the payment stack itself.
Core insight: The reasons shoppers give for abandoning split into two distinct fixes – checkout design for the UX causes, and payment infrastructure for declines and missing methods. Addressing only one half leaves the other untouched.
The payment causes most guides miss
Shopper surveys capture what people notice and can name. The mechanics behind a failed payment – what caused it and whether it was recoverable – rarely show up in survey responses. Some of the most common ones:
Soft declines. When a card is declined, the shopper sees one outcome: payment failed. What they can't determine is whether it was temporary or permanent. A hard decline – a closed account, a stolen card flag – is permanent.
A soft decline – insufficient funds at that moment, a temporary bank hold, an authentication timeout – is not. Soft declines account for 70–90% of all failed card-not-present payments, according to Solidgate's data. The shopper who left had no way of knowing their payment was actually valid.
False declines. Some declined transactions have nothing wrong with the card or the shopper – the payment was blocked by a fraud rule that fired too broadly. When that happens, the rule either blocks the transaction outright or routes it through a 3DS challenge.
Both outcomes lose the shopper: a hard block ends in "payment failed," and an unnecessary authentication step adds friction most shoppers don't complete. The card was valid. The purchase was legitimate. But the merchant lost the sale anyway – and the fix sits in how rules are configured.
Missing . A shopper who doesn't see their preferred payment method at checkout doesn't typically look for an alternative – they leave.
In markets where one method dominates, the impact is direct: no PIX in Brazil, no BLIK in Poland, no UPI in India means losing a significant share of that market. That loss shows up as a conversion gap by country, visible only when abandonment is segmented by market and payment method.
Failed renewals. For subscription businesses, the causes above repeat on every billing cycle. A soft decline on a renewal that goes unaddressed cancels an active subscriber. Data shows an average monthly involuntary churn rate of 7.2% – subscribers lost not because they chose to leave, but because a payment failed and wasn't recovered.
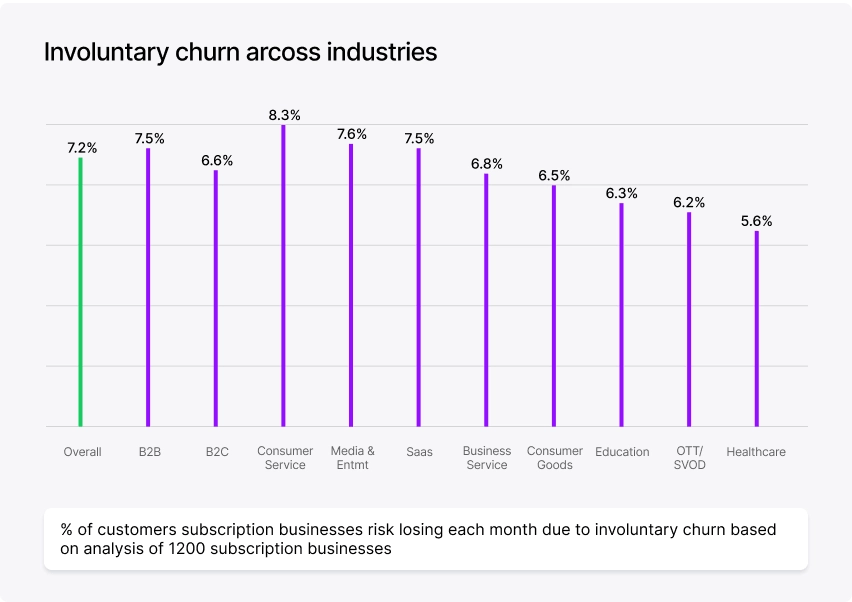
Core insight: Soft declines, false declines, missing payment methods, and failed renewals are payment stack problems that shopper surveys don’t typically surface.
How to reduce cart abandonment rate
Since cart abandonment splits into two different problems, the fixes do too.
Fix the checkout experience
The top UX causes – cost surprises, forced account creation, long forms, unclear totals – respond to checkout design changes. The core fixes:
- Show shipping costs and taxes before the final step
- Allow guest checkout
- Reduce form fields to what's strictly necessary
- Add digital wallet support for mobile
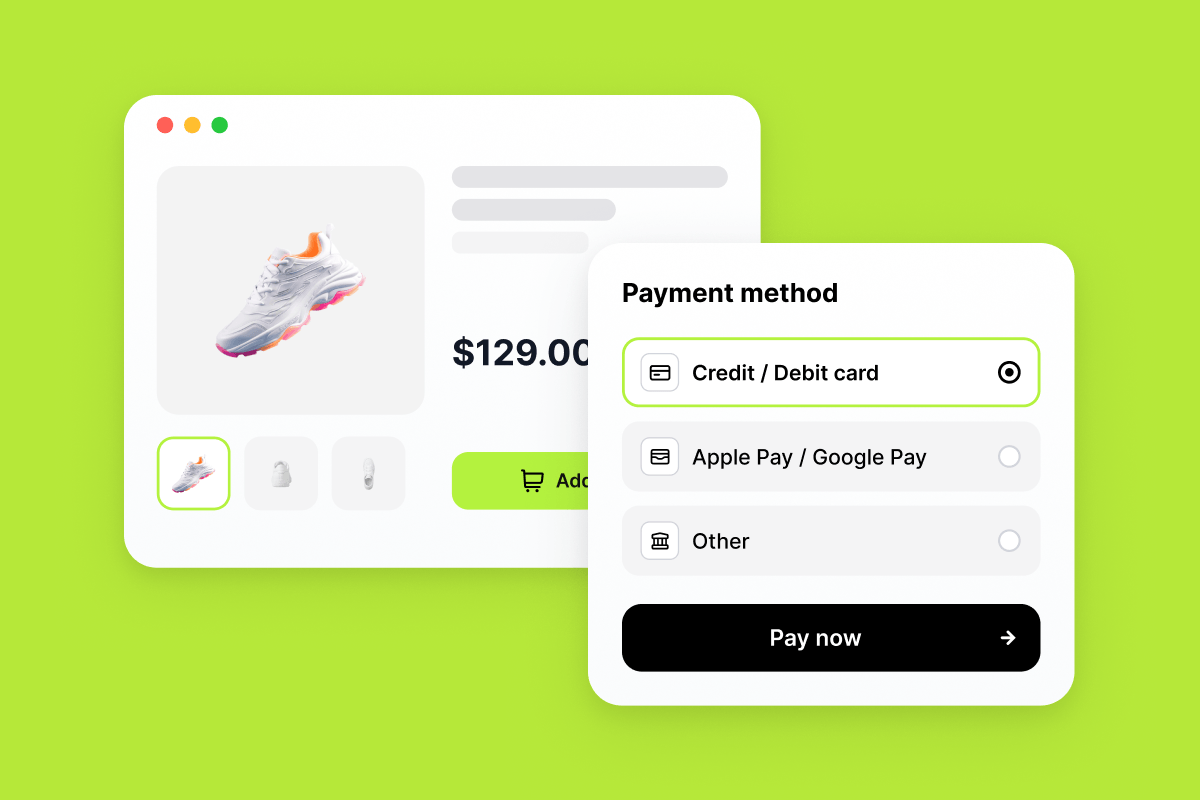
An that consolidates card entry, digital wallets, and local payment methods on one page removes form-field friction without a full rebuild.
See our guide for the full breakdown.
Fix the payment stack
The payment causes – soft declines, false declines, missing methods, failed renewals – don't respond to page redesigns. Each requires a specific infrastructure fix.
➡️ Soft declines need retry logic timed to when the payment is most likely to succeed.
➡️ False declines need fraud rules calibrated to actual risk signals rather than broad thresholds, so legitimate transactions stop getting blocked.
➡️ Missing payment methods need coverage expanded by market so shoppers in those markets have a payment path that works for them.
➡️ Failed renewals in subscription businesses need network tokenization and to keep stored credentials valid through card reissues, so a billing cycle doesn't fail because a card was replaced.
See our guide for the full breakdown.
Core insight: UX fixes and payment fixes address different causes and require different tools. Starting with data – your decline rate, your abandonment rate by industry and payment method – tells you which problem is larger and where to focus first.
How Solidgate helps reduce shopping cart abandonment
Solidgate is a with 100+ payment providers, acquirers, and alternative payment methods available through a single integration. It covers routing, acquiring, tokenization, and subscription billing. Here's how that translates to fewer abandoned carts.
Lower checkout friction with the embedded payment form
Solidgate's auto-adjusts language, currency, and payment methods based on the customer's location – a shopper in Poland sees BLIK, one in the Netherlands sees iDEAL, with no separate configuration per market.
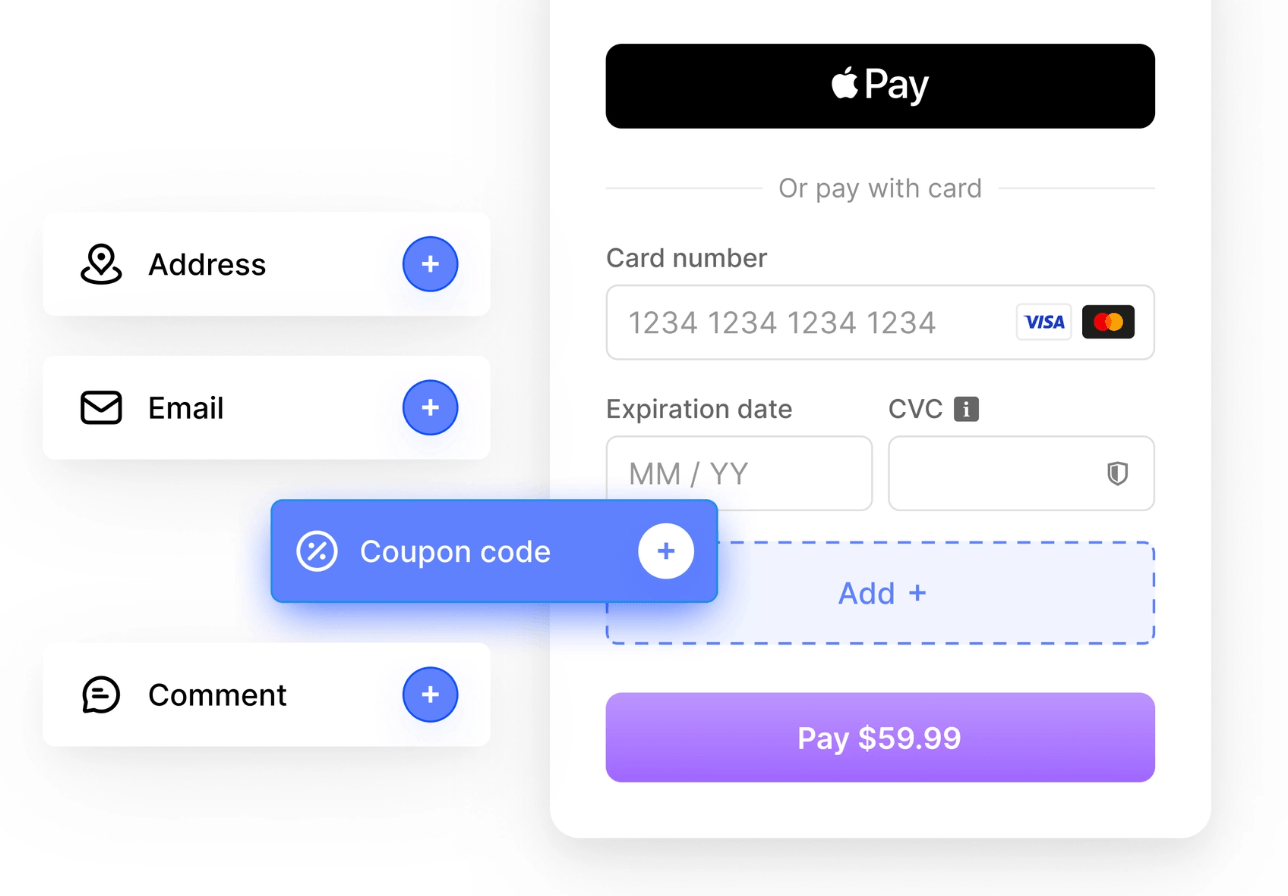
For returning customers, fields pre-populate and tokenized credentials mean one confirmation instead of re-entering card details.
Recover failed payments with smart retries
Solidgate's automatically identify the optimal moment to re-attempt a failed payment – factoring in the customer's payment history, decline reason code, local time zone, and issuer behavior patterns.
Since most failed payments are soft declines, better timing is what turns them into successful charges. According to Solidgate's data, merchants received revenue 23.6% faster and saw 10–15% fewer declines within subscription cohorts.
Increase approvals with intelligent routing
Solidgate's reads the signals on each transaction – card type, issuing bank, country, amount – and routes to the provider most likely to approve it. If that provider declines, cascading logic automatically retries through a fallback acquirer before the shopper sees a failure.
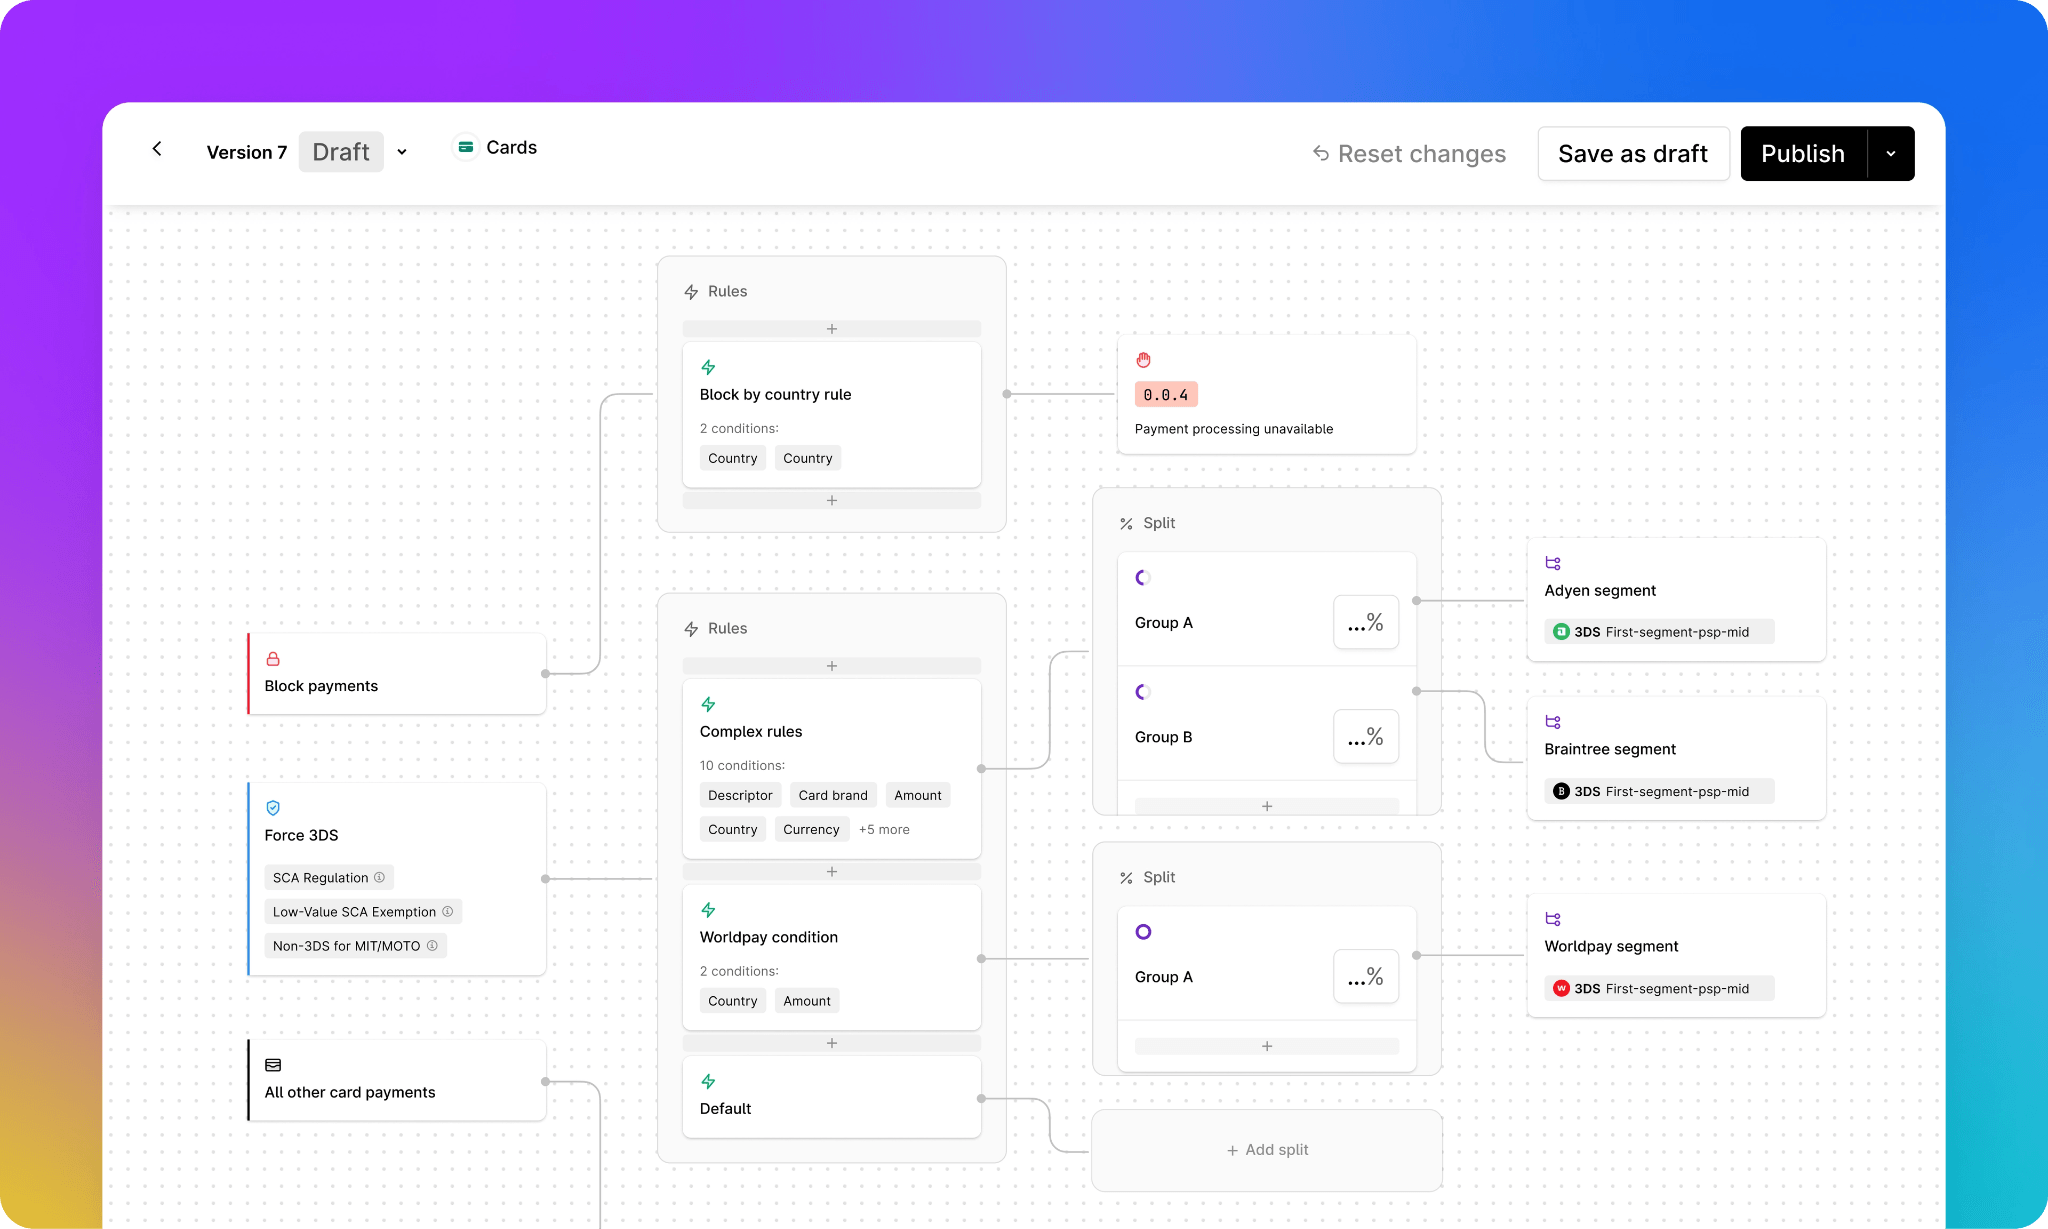
, an international streaming platform, saw a 3.5% lift in payment conversion and a 5% reduction in subscription churn after overhauling its payment stack. The fix covered routing to acquirers with stronger authorization rates by region, local payment methods, network tokenization, and smart retries.
For a deeper look, see our guide.
Expand payment coverage with alternative payment methods
Solidgate connects merchants to across 100+ global markets through a single integration. Add PIX in Brazil, BLIK in Poland, iDEAL in the Netherlands without separate contracts or additional engineering per market.
Protect stored credentials with network tokenization
Through direct partnerships with Visa and Mastercard, Solidgate requests and manages network tokens on the merchant's behalf, storing them in a PCI-compliant, provider-agnostic . The same token routes across any of Solidgate's 100+ connected providers without re-tokenization, so adding or switching providers never touches stored customer credentials.
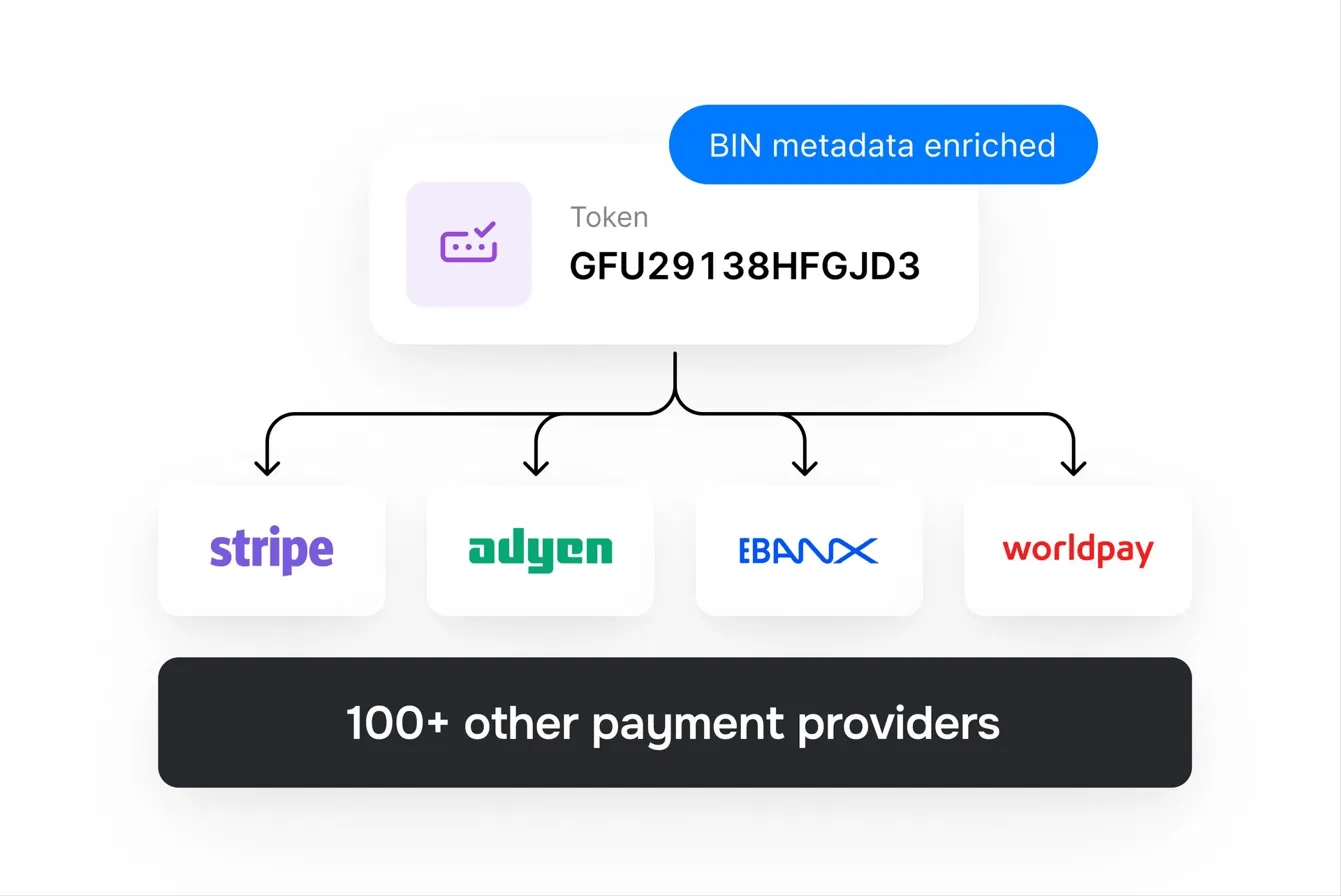
When a card expires or gets reissued, the token refreshes automatically through Account Updater. The next billing cycle fires against valid credentials without the customer or the merchant doing anything.
For subscription businesses, that removes one of the most common causes of silent churn – failed renewals. Solidgate merchants see retention improvements of up to 7.5% from network token lifecycle management, and 27% fewer failed payments through automated credential updates.
Cart abandonment is rarely one problem – and the payment layer is often where the most recoverable revenue sits.
to identify where your payment stack is losing revenue and find the right fix.
Frequently asked questions
There's no universal good rate – it depends on your industry. A DTC apparel brand in the high 70s is typical, while a pet care or consumer goods retailer at the same rate is underperforming its category. Compare your rate against your specific vertical's benchmark instead of the global average.
Divide completed purchases by total carts created, subtract that figure from one, then multiply by 100. If 300 out of 1,000 carts result in a purchase, the abandonment rate is 70%. Most analytics platforms calculate this automatically under conversion or funnel reports.
Declined cards and missing payment methods account for 18% of actionable abandonment in Baymard's survey. That figure reflects what shoppers can report – a shopper who sees "payment failed" rarely knows whether the decline was temporary or permanent, so soft declines and failed retries don't usually show up in survey data.
Recent articles