Payment analytics: How to turn transaction data into revenue
Payments 101
Updated 16 Jul 2026
11 min

Bogdan Kondakov
Payment Analytics Lead, Solidgate
Payment analytics tells you where revenue is leaking. This guide shows you what to do about it.
Most payments teams have a dashboard. But what counts is whether the data on it connects to a specific decision – logic, a retry adjustment, or a payment method addition.
When each metric leads to a concrete operational action, payment analytics drives revenue. When it doesn't, it's a record of what happened.
This guide covers what to measure, how to read the data, and what infrastructure decisions each metric points to.
TL;DR
- Payment analytics is the practice of collecting, segmenting, and acting on transaction data to improve authorization rates, reduce involuntary churn, and cut processing costs.
- The seven metrics that matter: authorization rate, decline rate by code, retry success rate, involuntary churn rate, chargeback rate, effective processing cost, and checkout conversion rate.
- Each metric needs to be broken down by acquirer, corridor, card brand, and payment method – the total-level figure tells you something is wrong; the segment-level figure tells you where and why.
- Orchestration is the infrastructure layer that executes what the analytics recommends – routing decisions, retry logic, account updater, and tokenization.
What is payment analytics?
Payment analytics is the process of collecting, segmenting, and acting on transaction data to improve payment performance across your stack.
For most digital businesses, that means tracking authorization rates by acquirer and corridor, decline codes by type, processing costs by route, and checkout conversion by market. Each data point answers a different operational question:
- Which acquirer is underperforming on a specific route
- Which declines are recoverable
- Where checkout drop-off is happening
- Where fees are higher than they need to be
The segmentation is what makes the data actionable. A soft decline on a German Mastercard renewal and a hard decline on a Brazilian Visa first payment produce the same failed transaction record. Segmented by code and acquirer, they point to completely different responses.
7 payment metrics that actually move revenue
These metrics tell you where your payment performance stands and what kind of problem you're dealing with.
| Metric | Formula | Benchmark | What a gap signals |
| Authorization rate | Authorized ÷ total attempts | 85–90% typical, 92–95% well-optimized | Routing, acquirer, or MCC problem |
| Decline rate by code | Declines by code ÷ total attempts | Soft declines: 80–90% of all declines in subscription businesses | Retry opportunity vs. card update needed |
| Retry success rate | Successful retries ÷ total retries | Soft decline recovery ceiling: 40–70% depending on strategy | Retry timing or logic not calibrated |
| Involuntary churn rate | Churned subscribers due to payment failure ÷ total subscribers | 7.2%, varying by industry | Tokenization or dunning gap |
| Chargeback rate | Chargebacks ÷ settled transactions | Below Visa VAMP threshold of 1.5% | Descriptor, cancellation, or fraud rule problem |
| Effective processing cost | Total fees ÷ total volume | Track vs. your own baseline by acquirer and corridor | Routing not optimized for cost |
| Checkout conversion rate | Completed payments ÷ checkout initiations | 60–85% (varies by market, device, payment method) | APM gap or authentication friction |
Note: Retry success rate and involuntary churn rate apply specifically to subscription and recurring billing models. The remaining five metrics are relevant to any digital business processing online payments.
Authorization rate
Authorization rate is the percentage of payment attempts the issuing bank approves. When a customer submits a payment, the transaction travels from your checkout through your acquirer to the card network and then to the issuer. The issuer makes the final decision – approve or decline – and authorization rate measures what percentage of those decisions come back as approvals.
The issuer's decision is shaped by signals your stack sends:
- Which acquirer routed the transaction
- Whether the credential was tokenized
- What MCC (Merchant Category Code) the merchant is registered under
- How many prior retry attempts the issuer has already seen from that card
This is why a total-level figure is insufficient as a diagnostic. A blended 87% rate could mean US domestic traffic is at 93% while Polish cross-border renewals are at 71% – two completely different problems that require different fixes. The average auth rate benchmark is 85–90% for digital businesses, with best-in-class setups reaching 92–95%+. A rate below that range in a specific corridor or card brand segment points to a gap worth investigating.
For a broader look at , see our guide.
Decline rate by code
Not all declines are equal. Hard declines – stolen card, account closed, do not honor with a permanent flag – mean the underlying card is gone. Soft declines – insufficient funds, technical timeout, general decline with a temporary flag – mean the card is valid but the transaction failed for a recoverable reason.

Soft declines account for 80–90% of all declines in subscription businesses. A blended decline rate tells you how many transactions failed while the code-level breakdown tells you whether you have a retry opportunity or a card update problem.
Retry success rate
Retry success rate measures what percentage of retried payments actually succeed. It directly quantifies how much failed-payment revenue your dunning infrastructure recovers each billing cycle.
Three factors determine how much of your soft decline volume is recoverable:
- Whether the decline code is retryable at all
- Whether the retry timing aligns with issuer behavior
- Whether the retry sequence stays within card scheme limits
A retry success rate below 20% on a soft decline portfolio signals that at least one of those three factors is miscalibrated.
Involuntary churn rate
Involuntary churn is revenue lost when a subscriber's payment fails and the subscription lapses – the account was active and the subscriber had not cancelled.
Several factors cause a subscriber's payment to fail at renewal:
- The card has expired or been reissued with a new number
- The account had insufficient funds at the time of the attempt
- The issuer declined the merchant-initiated transaction due to a risk signal tied to how the credential was stored or how the merchant is categorized
The average monthly involuntary churn rate is 7.2%, varying by industry.

A rate above that benchmark – particularly concentrated in specific card brands, markets, or subscriber cohorts – signals a tokenization gap, a dunning logic problem, or both.
Chargeback rate
Chargeback rate measures the percentage of settled transactions that cardholders reverse through their issuing bank. Visa's VAMP sets the merchant excessive . Breaching it triggers per-transaction enforcement fees and, if sustained, gives your acquirer grounds to restrict the merchant account.
A chargeback spike in a specific market, product line, or billing period usually points to one of four causes:
- A billing descriptor customers don't recognize, leading to "I don't know this charge" disputes
- A subscription cancellation flow that doesn't stop charges on the expected date
- A fraud pattern that rules caught too late, after chargebacks had already accumulated
- A specific acquirer corridor with higher dispute rates than the rest of the portfolio
A descriptor problem, for example, is fixable with a descriptor change and pre-dispute interception. Tools like Solidgate's and resolve disputes before a formal chargeback is filed, which means they don't count toward the VAMP ratio.
Effective processing cost
Effective processing cost is total payment fees – interchange, scheme fees, acquirer markup, payment service provider (PSP) fees – expressed as a percentage of total volume.
Most businesses know this figure at the total level but not at the route level. Two acquirers processing the same transaction type in the same corridor can carry different fee structures. When one delivers a comparable authorization rate at a lower cost, every transaction routed to the more expensive option is a margin loss the total-level figure never surfaces.
Checkout conversion rate
Checkout conversion measures how many customers who initiate a payment actually complete it. The gap between checkout initiation and completed payment has several causes:
- The customer's preferred payment method isn't available
- 3D Secure (3DS) adds unnecessary friction to a low-risk transaction
- The checkout form itself has too many steps
Each cause operates at a different stage of the checkout flow, which means the segment breakdown – by market, device, and payment method – is what determines where the drop-off actually happens. A conversion drop concentrated in a single market points to a payment method gap. A drop spread across markets and devices points to authentication friction or form design.
Core insight: Each of the seven metrics maps to a specific operational fix. Segment-level data is what makes each fix actionable.
How to build a payment analytics dashboard
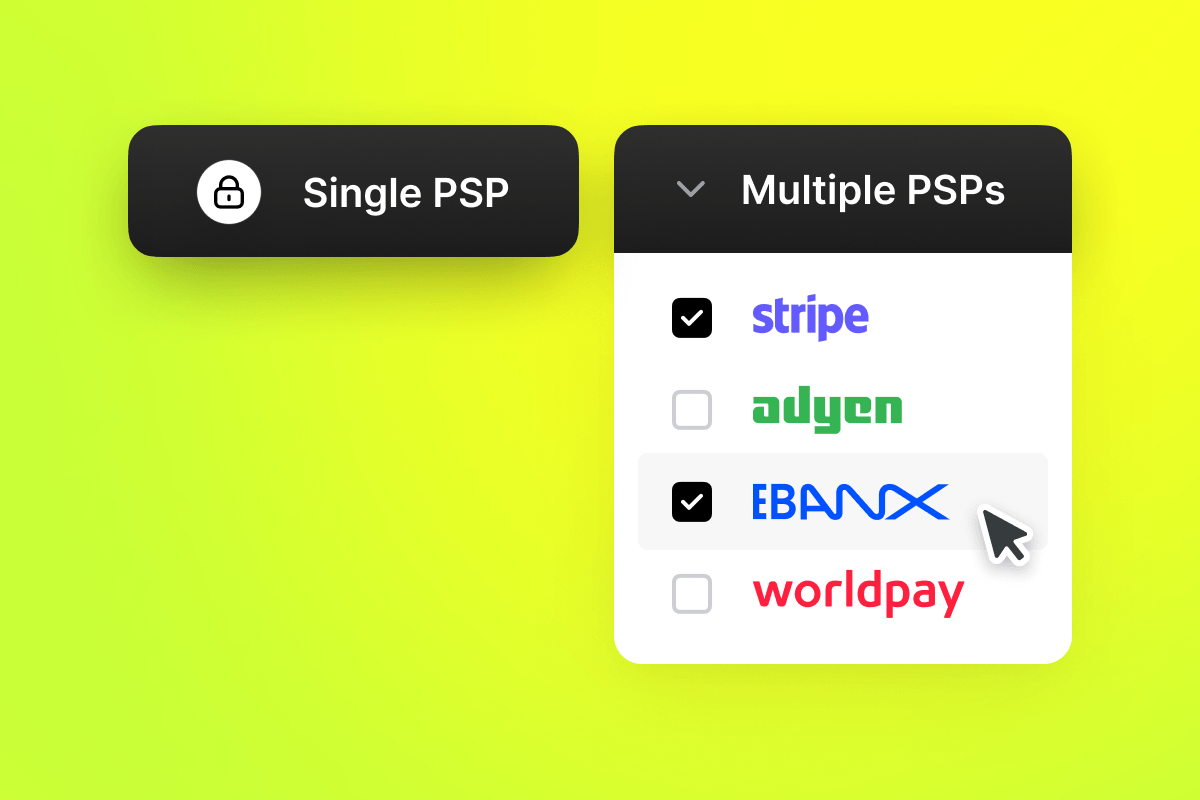
A payment analytics dashboard consolidates approval rates, decline codes, processing costs, and conversion data into a single operational view. The right setup depends on whether you're running a single PSP or a multi-acquirer stack.
If you're running a single PSP, start with its native dashboard. Most PSP dashboards surface approval rate, decline codes, and dispute data at the transaction level – enough to identify where problems exist.
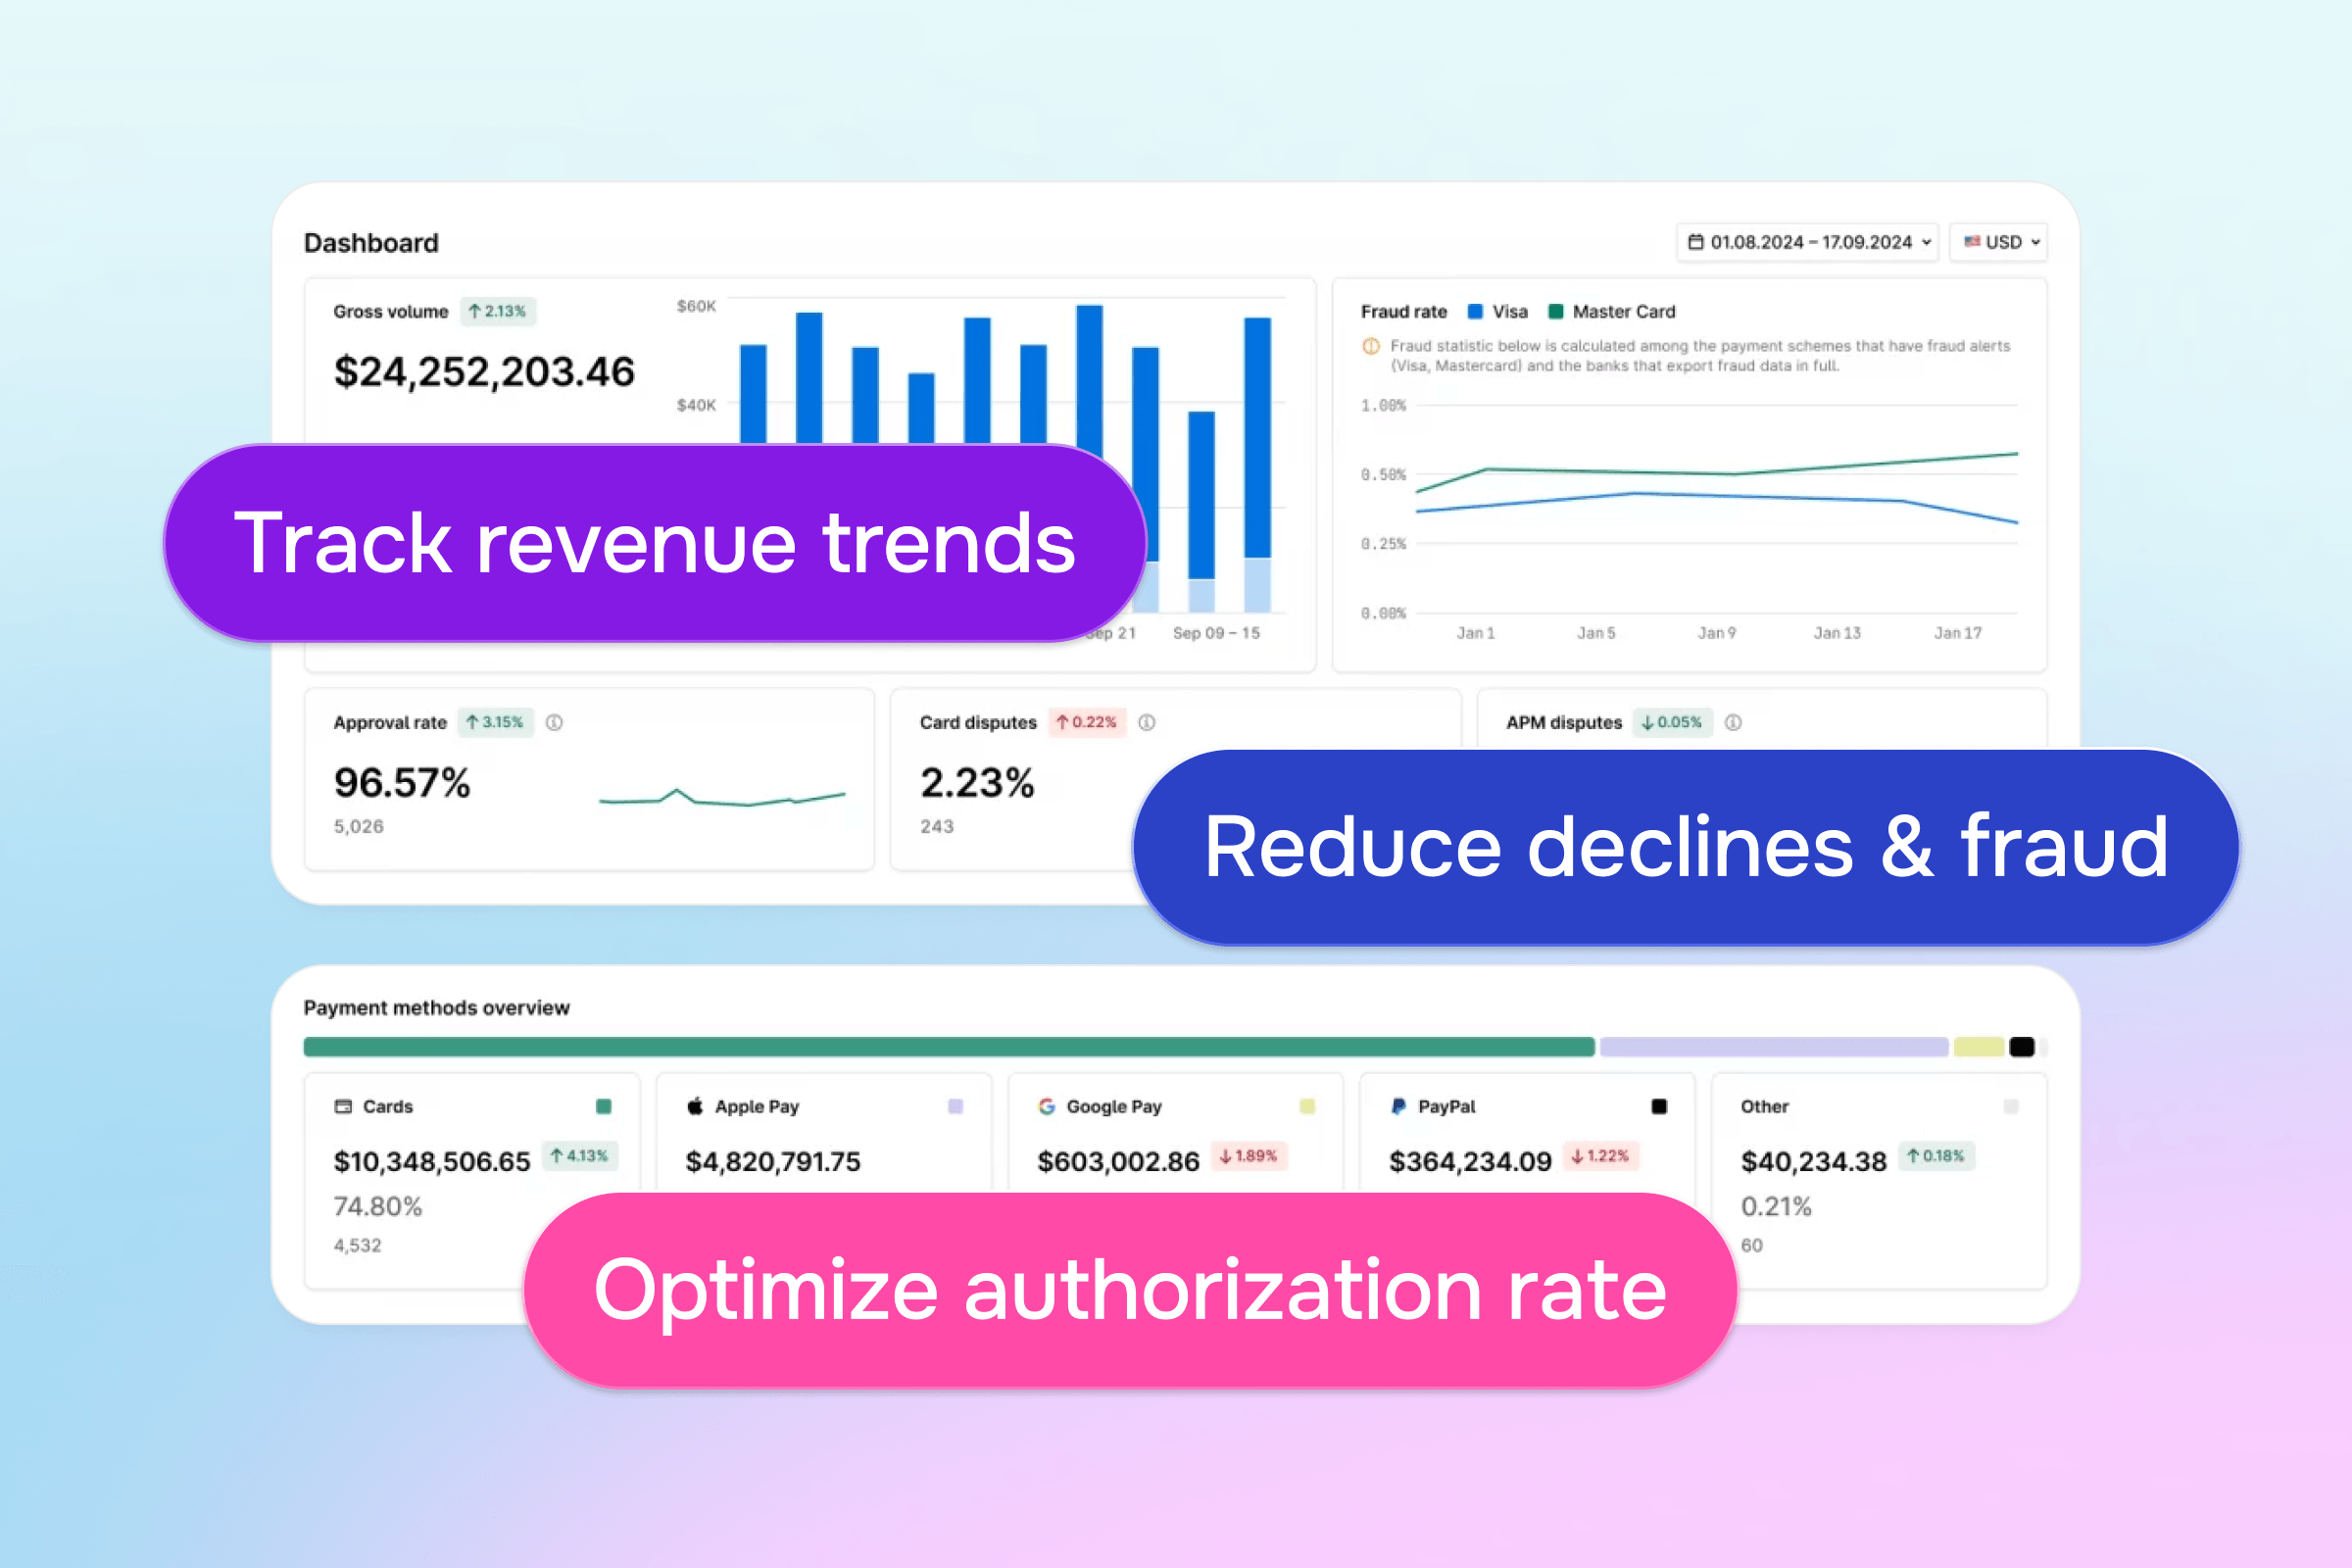
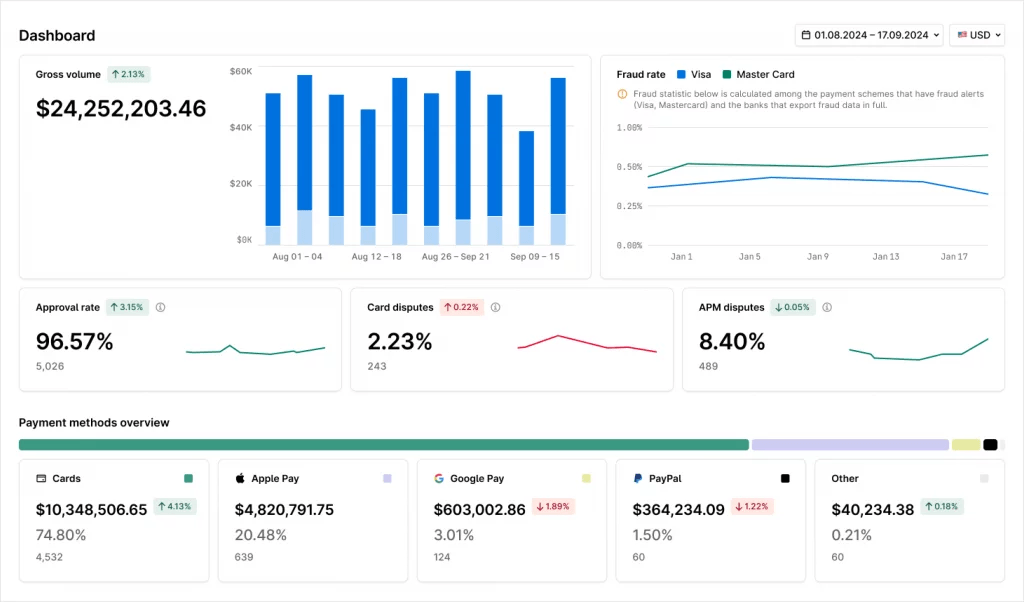
If you're running a multi-acquirer setup, the most direct path is an orchestration platform. You connect your acquirers through a single API and the platform normalizes transaction data from every connected provider into a unified schema automatically. Solidgate Hub, for instance, gives you:
- Payment analytics – approval rate, gross volume, and decline breakdown
- Risk analytics – fraud rate, dispute rate, and refund rate across card networks and APMs
- Payment methods overview – volume and share breakdown by payment method
Core insight: Start with your payment infrastructure. Single-provider setups use the PSP's native dashboard. Multi-provider setups need a layer that normalizes data across all connected providers into one view.
Payment analytics use cases: Where the data pays off
Tracking payment metrics is only half the job. Each metric points to a specific business outcome – and to the infrastructure decision that delivers it. Here is what acting on that data looks like in practice.
Higher revenue capture at checkout
Offering the right payment methods in each market and each transaction to the right acquirer prevents losing customers who were ready to pay.
finds 10% of shoppers abandon checkout specifically because their preferred payment method isn't available. In the Netherlands, that's iDeal. In Poland, it's BLIK. In Brazil, it's PIX. Checkout conversion rate segmented by market shows exactly where that gap exists and which APM to add first.
segmented by acquirer and corridor shows which routes are underperforming. Each acquirer has different issuer relationships by market and card brand – the same transaction routed to a better-matched acquirer gets approved where the previous one was declined.
Auth rate gaps don't always trace back to routing or APM coverage. Sometimes the issue is MCC (Merchant Category Code) misalignment – when the merchant category a business is registered under doesn't match its actual transaction profile, issuers apply the wrong risk model before routing even runs.
HOLYWATER TECH had routing optimized and cascades live across six acquirers but MCC misalignment was suppressing approval rates across all of them. Correcting the classification lifted approval rates 5–7% with no product changes.
Read the full .
More revenue recovered from failed payments
Soft declines are failed transactions with a recovery path. The question is whether your retry logic knows when to go back for them.
Decline code data separates recoverable soft declines from permanent hard declines. Retry success rate shows how much of that recoverable volume your current logic is actually getting back. The gap between those two numbers is revenue leaving every billing cycle.
The fix is timing. An insufficient funds decline retried the same day rarely clears – the cardholder's account hasn't changed. The same decline retried three to five days later, after their pay cycle resets, succeeds far more often.
Staying within scheme limits matters equally: allows 20 retries per 30 days. Exceeding those limits on any transaction generates VAMP exposure.
Solidgate's delivers 51–67% improvement in first retry conversion by aligning timing to issuer behavior patterns.
Stronger subscriber retention
Subscribers lost to involuntary churn were paying customers whose stored card credential expired before the renewal processed.
Involuntary churn rate segmented by card brand, market, and cohort shows where expired credentials are concentrated. That's the deployment decision: which segments to prioritize when rolling out network tokenization.
Once Visa Token Service (VTS) and Mastercard Digital Enablement Service (MDES) are live, the token links to the card's digital account rather than the physical card number. When a card is reissued, the token updates at the network level. The renewal succeeds without cardholder action.
shows a 4.6% authorization rate lift for card-not-present (CNP) transactions when network tokens replace raw PANs.
reduced subscription churn by 5% after implementing VTS/MDES tokenization and account updater across its renewal flows.
Better margins on revenue you're already processing
Not all revenue improvements come from fixing failures. Effective processing cost and chargeback rate point to margin gains on transactions that are already succeeding.
Effective processing cost tracked by acquirer and route surfaces a margin gap that authorization rate data alone never shows. Two acquirers can deliver identical approval rates on the same corridor while charging materially different fees. At $5M monthly volume, a 0.3 percentage point cost difference between two routes is $15,000 per month – recovered without touching pricing or conversion.
Chargeback rate segmented by market, product line, or billing period shows where disputes are building before they hit Visa's VAMP threshold of 1.5%. A descriptor customers don't recognize, a cancellation flow that fires late, a fraud cluster in one corridor – each is fixable early if the data surfaces it in time.
Core insight: Analytics identifies where revenue is leaking and how much. The routing rules, retry sequences, network tokenization, and cost routing decisions that follow are what recover it.
Payment analytics tools and reporting
The right tool depends on your infrastructure and what you need the data to do.
PSP native dashboards – every major payment provider includes built-in reporting that surfaces approval rates, decline codes, dispute rates, and volume for that provider's traffic. The right starting point for single-provider setups.
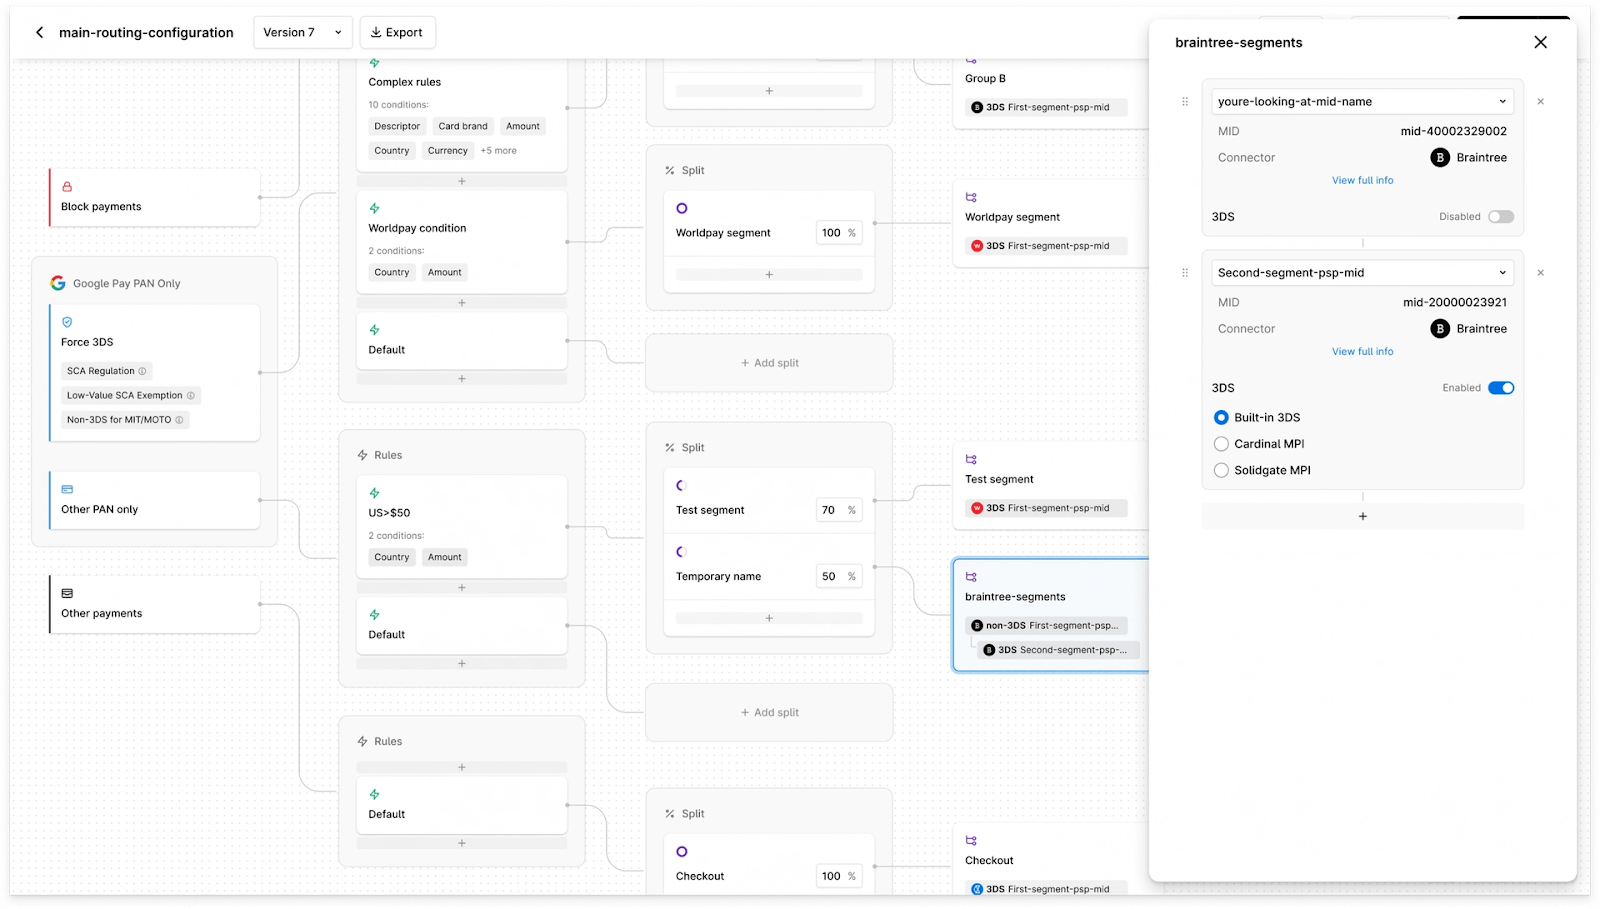
Payment orchestration platforms – normalize transaction data from all connected providers into a single schema. Authorization rates, decline codes, and processing costs become comparable across acquirers in one view. The routing rules that act on those comparisons run on the same platform. The right setup for multi-acquirer businesses where cross-provider analysis drives routing and retry decisions.
See how works.
BI tools and data warehouses – exporting transaction data into a warehouse (BigQuery, Snowflake) and building dashboards in a BI tool (Looker, Tableau, Metabase) gives flexibility for cross-functional modeling. The right choice for finance and analytics teams building LTV models, cohort analysis, or revenue forecasting. Requires data engineering investment to build and maintain.
– connect payment outcomes to subscriber lifecycle data. Cancellation trends, churn by cohort, MRR movement, and dunning recovery aren't visible at the transaction level alone. A setup for any business with recurring revenue.
| Tool | Best for |
| PSP native dashboard | Single-provider setups |
| Payment orchestration platform | Multi-acquirer setups needing cross-provider analysis |
| BI tools and data warehouses | Finance and analytics teams building cross-functional models |
| Subscription billing platform | Businesses with recurring revenue |
Core insight: The analytics setup that matches your infrastructure is the one where the data and the execution layer are the same system. Seeing that a corridor is underperforming is only useful if the routing rule that fixes it is one step away.
Turn payment data into action with Solidgate
Payment data shows you where revenue is leaking. Acting on it requires infrastructure that can execute the fix – , retry sequences, tokenization, APM additions – without rebuilding your stack each time.
Solidgate is a that connects you to 100+ acquirers, providers and alternative payment methods, giving you the analytics and the execution layer in a single integration.
If you want to see how it works for your payment setup, .
Frequently asked questions
Payment data analytics is the practice of collecting and segmenting transaction data to diagnose payment performance gaps and determine which operational decisions close them – whether that's a routing change, a retry adjustment, or a tokenization rollout.
The most important payment KPIs for any digital business are authorization rate, chargeback rate, effective processing cost, and checkout conversion rate. For subscription and recurring billing businesses, add decline rate by code, retry success rate, and involuntary churn rate. Track each at the segment level – by acquirer, market, card brand, and payment method. The total-level figure identifies that a problem exists. The segment-level figure identifies where it is and which lever addresses it.
Payments analytics falls into four categories. Descriptive analytics summarizes what happened: authorization rates, volume, failure counts. Diagnostic analytics explains why: decline code breakdowns, acquirer performance comparisons, corridor gaps. Predictive analytics forecasts what's likely: which subscriber cohorts face the highest involuntary churn risk. Prescriptive analytics determines the action: route to this acquirer, retry on this day, add this payment method in this market.
Effective payment analysis requires transaction-level data with the following attributes:
- Outcome (authorized, declined, refunded)
- Decline code where applicable
- The acquirer that processed it
- The issuing country
- The card brand and BIN (Bank Identification Number) range
- The payment method
- The transaction timestamp
For subscription businesses, linking payment outcomes to subscriber records is essential for involuntary churn analysis and smart payment routing decisions across renewal cycles.
Recent articles